Lives in your Google Sheets sidebar

The analyst in your sheet.

Ask in plain English โ€” run-on and all. Columnly cleans, reshapes, computes, writes real formulas, and ships hosted analyst briefs and dashboards where every figure traces back to the cell it came from. It never edits your original sheet unless you ask, and every write has full undo.

Add to Google Sheets See a real brief โ†“
Reads your open sheet ยท nothing stored at rest ยท no prompt engineering
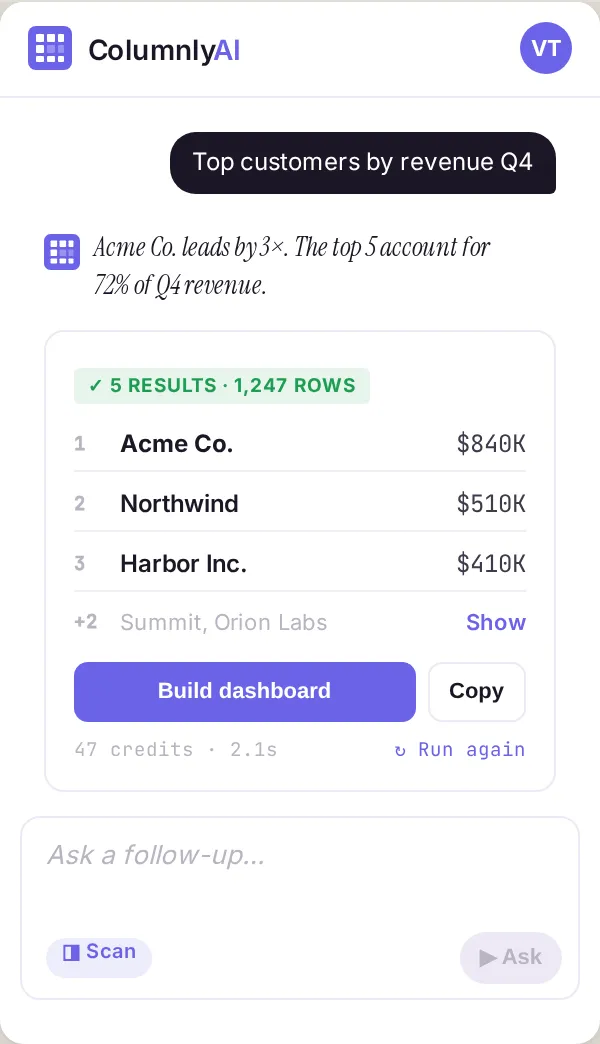
Columnly sidebar in Google Sheets
The standout feature

It asks the right questions before it builds.

Before an expensive build, Columnly asks only the questions your prompt left genuinely open โ€” never more than four. Each comes with 3โ€“4 concrete options grounded in your actual data, a recommended one marked, and a free-text escape. Then it shows a plan card to confirm.

Grounded

Options from your data

It never asks what your prompt already settled or what the data shape forces โ€” a clear dominant figure means it leads with that; a funnel shape means it builds a sequence.

Never blocks

Skip and it uses the pick

Skip the questions and it proceeds with the recommendations. The questions help; they never get in your way.

Deterministic

Same inputs, same plan

The questions are the only stochastic part โ€” all the gating logic is deterministic, so the same inputs always yield the same plan.

The same two-model brain

A Mapper proposes. An independent Verifier re-derives. They must agree.

Pure conversation is answered directly โ€” no wasted verification. A "clean this sheet" request becomes one verified sub-goal per real problem found, and follows a preserve-never-destroy rule: an unfixable value is left exactly as-is; it never guesses.

What it does to your sheet

Four operations, each verified.

Clean

Standardize without guessing

Normalize variant values with a completeness guarantee โ€” every distinct value accounted for, nothing guessed, a cell never blanked unless you ask.

Formula

Live formulas, verified

Writes real, recalculating Sheets formulas, each cross-checked against an independent computation before it lands. Data-exfiltration functions are blocked.

Restructure

Reshape anything

Pandas-backed pivots, unpivots, crosstabs, group-aggregates, splits, explodes, windows and ranks โ€” chained in one pass through a safe op vocabulary.

Format

Style with intent

Fonts, fills, borders, banding, number/date/accounting formats, plus full conditional-formatting rules on number, text and date predicates.

The backbone

The model writes the plan. A deterministic engine does the work.

Columnly's model drafts a structured plan; a pure-Python engine executes it and returns an honest diff of exactly what changed โ€” and it never edits your sheet directly. A separate step applies the verified result. No arbitrary code runs on your sheet, and failures are loud, never silent.
The output ยท hosted, byte-verified

Analyst briefs and dashboards, every figure cited.

Columnly writes the artifact directly, and five deterministic verifiers gate it: every figure must carry a citation to a stored, machine-computed value and match it exactly. A number that doesn't trace is deleted before ship. It writes two candidates and a skeptical critic โ€” seated as a busy decision-maker โ€” picks the better one and can force a revision.

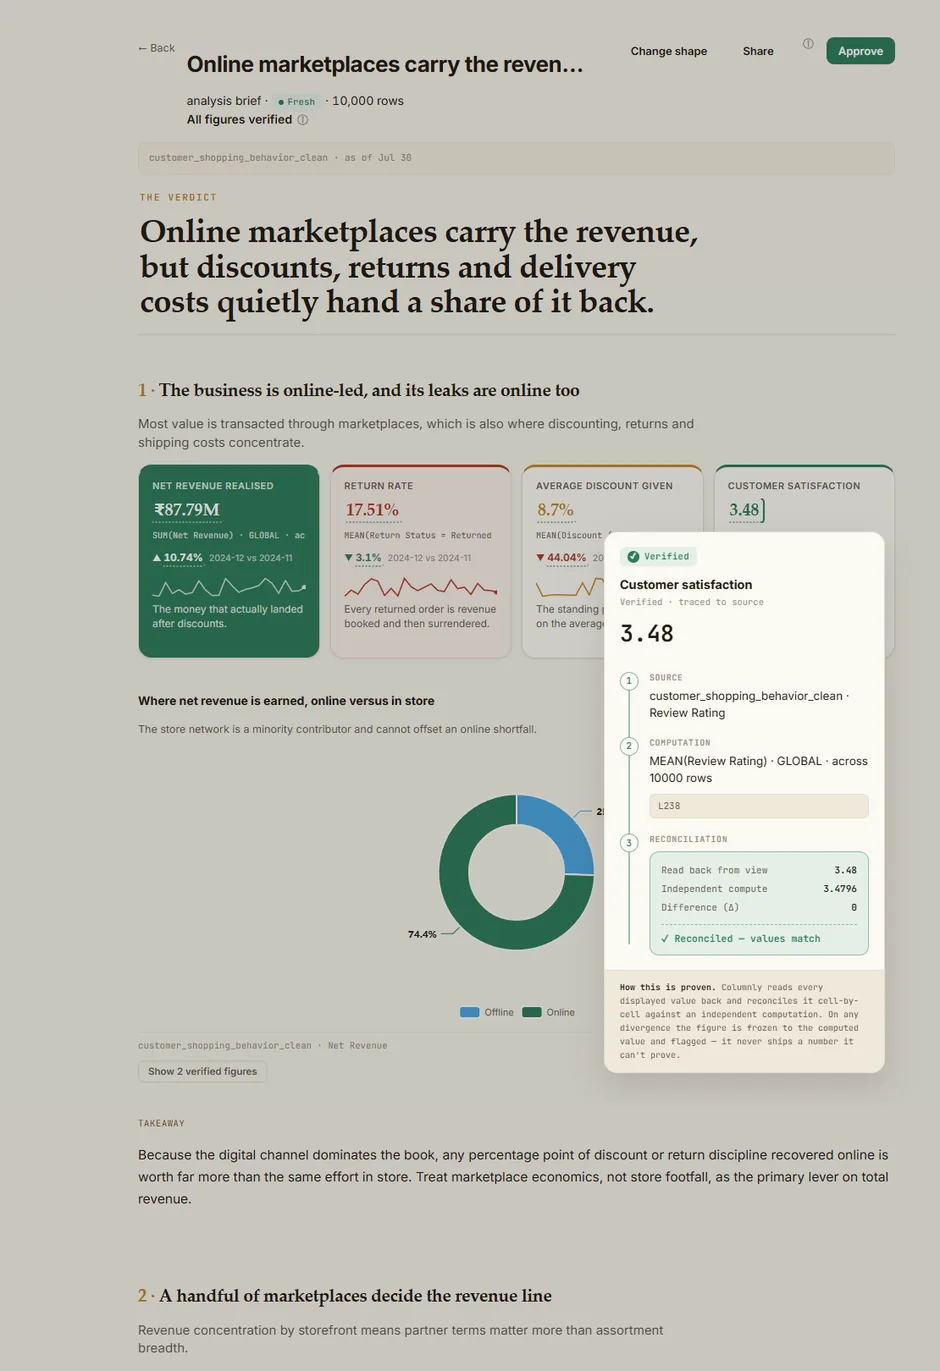
columnly.ai / brief / demo
A glimpse of a real Columnly analyst brief, with a figure's trace open

Analyst brief โ€” a glimpse of a real one. Thesis, a scorecard, the evidence โ€” every figure one tap from its source.

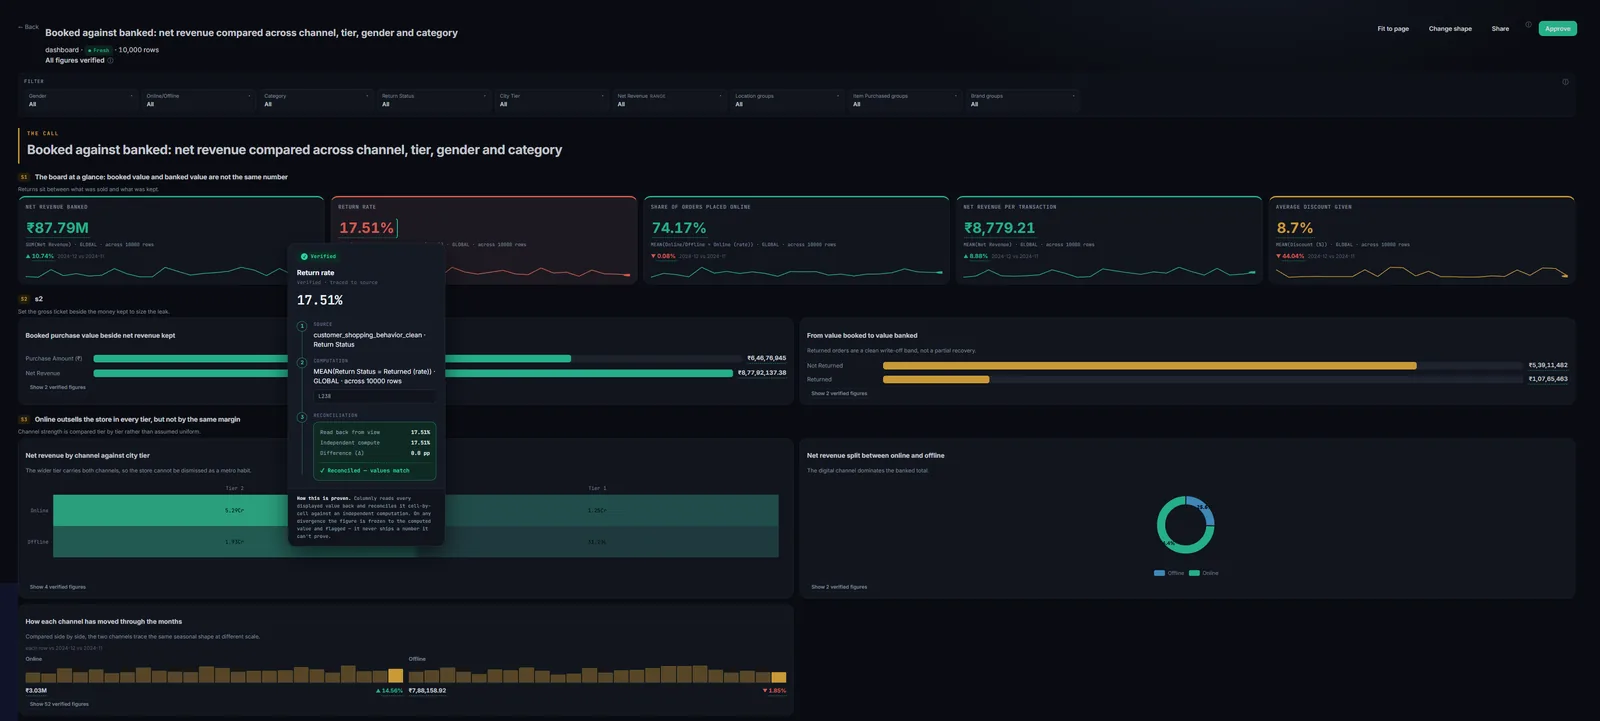
columnly.ai / dashboard / demo
A real Columnly dashboard โ€” dense instrument, all figures verified

Dashboard. A dense instrument โ€” KPI scorecard, verified figures, the trace one tap away.

Refuse at the source

It can't invent a number

The author can only display stored values. If it needs a figure that doesn't exist, it asks the engine to compute it โ€” verified โ€” rather than making one up.

8 design identities

Colour belongs to the data

Four dark instrument themes and four light themes, all WCAG-AA contrast-checked, one accent each. A brief is an argument; a dashboard is a dense instrument.

Grounded up front

Full-dataset statistics

A pure-Python stats engine computes correlations, distributions, trends and segments before the model runs โ€” so analysis is grounded in the whole dataset, not a sampled prompt.

Across your whole workbook

It won't stop at one tab. Coming soon

Most real questions live across several tabs. Columnly is learning to read the entire workbook and reconcile it into one answer โ€” checking before it combines, so a cross-tab number is reconciled, never silently merged.

Coming soon

One answer from many tabs

Orders here, costs there, a legend over there โ€” stitched into a single brief or dashboard.

Coming soon

Crosstab analysis

Pivot one dimension against another โ€” counts, sums, shares โ€” into a clean, labelled grid from a plain-English ask.

Coming soon

Formula reconciliation

Point at a cross-tab formula and ask "what does this do?" โ€” it explains it and traces every input back to its tab.

Stop charting your sheet. Start deciding with it.

Add Columnly to Google Sheets and get an analyst that proves its work โ€” right where your data already lives.